Current Transport Mechanisms in Thin Dielectric Films (with FGA)
Monday, 18 March 2013
Friday, 22 February 2013
[Q6] and [Q7] Plot Fowler-Bordheim(FN) graph on log-lin scale and calculate the barrier height
The graph of FN graph is shown as following:
The whole graph looks strange for the break down range. Therefore, the experimenter cut only the range of near zero data. The data is almost right refer to the material the supervisor gives us.
The current density J and electric field E in the insulator can be related as follows:
So that it is important to convert the Ln value of J/(E^2) and the slope is a function of barrier height.
The calculated barrier heights are 26.97, 21.98 and 19.10. The results don't have the physical meaning.
[Q5] Plot Poole-Frenkel(PF) graph on log-lin scale and calculate the value of dynamic permittivity of the oxide
The Poole-Frenkel graph is shown as following:
According to the equation 2, the graph that of Ln(J/E) has been plotted:
Five slopes of plot have been used to calculate the dynamic permittivity by using the equation 3.
From the diagram, the five slopes and the values of dynamic permittivity are displayed in the chart.
As we discussed with Dr. I. Mitrovic, the relationship of J and E in PF can be shown in the equation 1, so that the equation 2 can be deduced that the Ln values of J/E can be calculated by a linear equation of square root of E.
 |
| Equation 1 |
 |
| Equation 2 |
 |
| equation 3 |
[Q4]Polt linear-linear IV graph and determine the Ohmic range
The graph of linear-linear IV graph has shown before in [Q1].
As considered, the Ohmic range is from -4V to about -3.5V+/-0.2V.
As considered, the Ohmic range is from -4V to about -3.5V+/-0.2V.
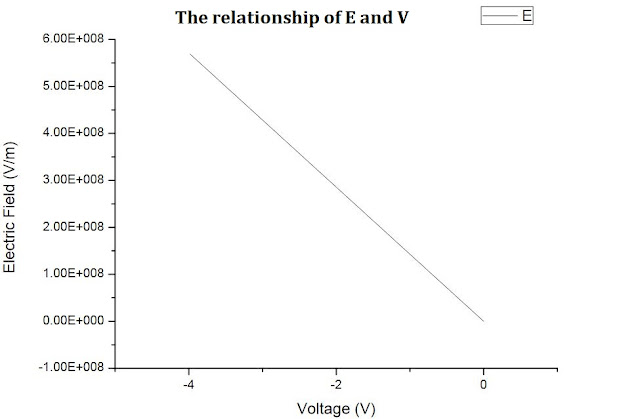
[Q3]The electric field across the oxide and interfacial layer
So, the result of electric field should be a series of data as the same of following graph.
Friday, 8 February 2013
[Q2]Calculate the equivalent oxide thickness(EOT) of the gate stack and the LaLuO3 oxide relative perimittivity(k)
According to Wikipedia, an Equivalent oxide thickness is a distance, usually given in nanometers (nm), which indicates how thick a silicon oxide film would need to be to produce the same effect as the high-k material being used.
The EOT definition is useful to quickly compare different dielectric materials to the industry standard silicon oxide dielectric, as: ..........................................................(1)
Use the equation (2), EOT = 2.876nm, and k=9.48.
............................................(2)
The value of EOT is quiet reasonable, while k is much smaller than theory (k should be around 32).
Please live message about how to calculate k.
[Q1] IV characteristics for both negative and positive bias
Here is the I-V characteristics for both negative and positive bias on the gate. Because the Negative bias data was not at the same order of magnitude, so the second graph here is the negative bias of voltage from -4V to 0V.
Also Dr I. Mitrovic will double check the data today afternoon and the graphs should be changed if the data changed.
As for which side is in accumulation, because the substrate is p-type Si, the negative side of the plot is in accumulation.
Also Dr I. Mitrovic will double check the data today afternoon and the graphs should be changed if the data changed.
As for which side is in accumulation, because the substrate is p-type Si, the negative side of the plot is in accumulation.
Subscribe to:
Comments (Atom)


